This is an ever-growing list of the projects I have worked on. Everything that you can interact with on this website is an archived copy. Some projects will redirect you to other websites.
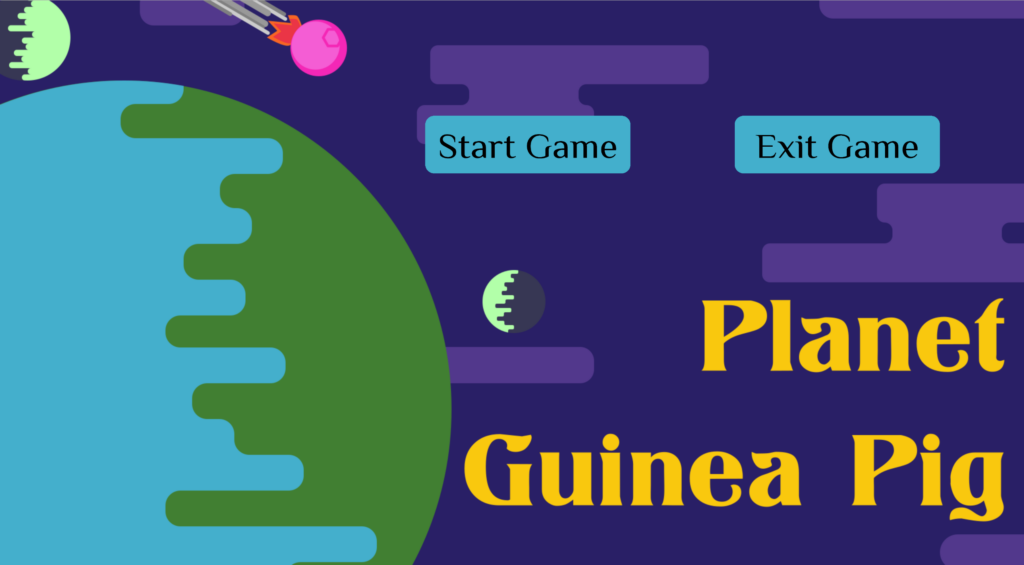
Project Guinea Pig
Work Summary
In just 36 hours, my team and I developed a guinea pig city building game entirely from the ground up using Processing. As the lead programmer for the project, I not only oversaw the technical aspects but also actively contributed by writing over 700 lines of code. This code encompassed a range of features, including the implementation of hexagonal hit-boxes for game mechanics, the creation of a GUI for players, and the integration of interactive buttons and exposition sequences. We were awarded the second-best project in the video game category at the DandyHacks Hackathon.
Story
You are the head guinea pig creating your new home after humankind nuked Earth into oblivion. As your motherball lands on an unknown planet it is up to you and your fellow guinea pigs to terraform the planet and build a thriving community. From your small stock of seeds and food, you will grow your community into a successful civilization…
Surf N’ Turf
Work Summary
Over the course of a semester, my group and I designed, prototyped, and then created an entire game from scratch. This included scripts for each object, each art asset, each music asset and all dialogue. I was the head programmer of the team, wrote 90% of the project code. This included programming mini-games, character interaction, a ground up dialogue system, in game reputation, vehicle control and collision, and a variety of other content.
Game Description
The Genre of the game is Dating Sim and as such it is recommend players are 16+. It can be played in under 10 minutes and there is a rich dialogue and karma system. WASD to move arrow keys for dialogue, Escape for pause, and a mix between Space/Enter for other things (the controls are not consistent).
It’s your 18th birthday and there’s a mysterious vibe in the air. Your father has been awfully cagey these past few days and you have a strong suspicion something is about to go down. He has a present he’s been waiting to give you…
SIMCON 44 Convention Website
SIMCON 44 is New York’s longest-running tabletop convention. In addition to being part of the planning committee, my responsibilities included organizing events during the convention and handling the convention finances. Additionally, I designed, set up, and managed the website. Google tracking is also integrated into the site to measure engagement metrics.
Video Game Sales Cluster Analysis
This paper conducted a cluster analysis of video game sales data from January 1980 to October 2016, sourced from vgchartz.com. The analysis involves preliminary data exploration, preprocessing, and clustering using k-means and fuzzy c-means methods to determine the optimal clusters. The focus was on understanding how regional and cultural differences affect game sales based on genre. The dataset includes 11 attributes and covers 16,598 games released internationally. The paper’s objective is to assess the role of a game’s genre in regional sales. The findings aim to uncover patterns and influences on video game sales.
PlotPal
This script creates a graphical representation of data points on a map based on the content of a text file using PyPlot. I created it to track movement of a character on a map and as a way to get better acquainted with PyPlot.
import matplotlib.pyplot as plt, matplotlib.image as mpimg, numpy as np, os, re
from matplotlib import transforms

fig = plt.gcf()
fig.canvas.manager.set_window_title('Coordinate Plotter')
os.chdir(os.path.dirname(os.path.realpath(__file__)))
ax = plt.gca()
ax.set_xlim(-10000, 10000)
ax.set_ylim(-10000, 10000)
ax.invert_yaxis()
plt.tight_layout(pad=0.05)
fig.set_facecolor('#000000')
img = mpimg.imread('map.png')
img = np.flipud(img)
tr = transforms.Affine2D().rotate_deg(180)
imgplot = plt.imshow(img, aspect='equal', extent=[-10140, 10140, -10120, 10120])
sensors = []
user = "john"
query = "Enter"

with open("Hits.txt", "r") as a_file:
  for line in a_file:
    stripped_line = line.strip()
    if ( user in stripped_line):
      if( query in stripped_line):
        print(stripped_line)
        time = re.search(r'\d\d\:\d\d\:\d\d', stripped_line)
        (h, m, s) = time.group().split(':')
        secondstime = int(h) * 3600 + int(m) * 60 + int(s)
        coords = re.search(r'\d{1,5}\ \d{1,5}\ \d{1,5}', stripped_line)
        (x, y, z) = coords.group().split(' ')
        sensors.append([secondstime, int(x), int(z)])
sensors.sort(key= lambda x: x[0])
(x,z) = np.array(list(list(zip(*sensors))[1])), np.array(list(list(zip(*sensors))[2]))
plt.plot(x,z, 'o', color='#00A0FF', markersize=2, zorder=2)
plt.plot(x,z, ':w', markersize=2, zorder=1)
plt.show()
